

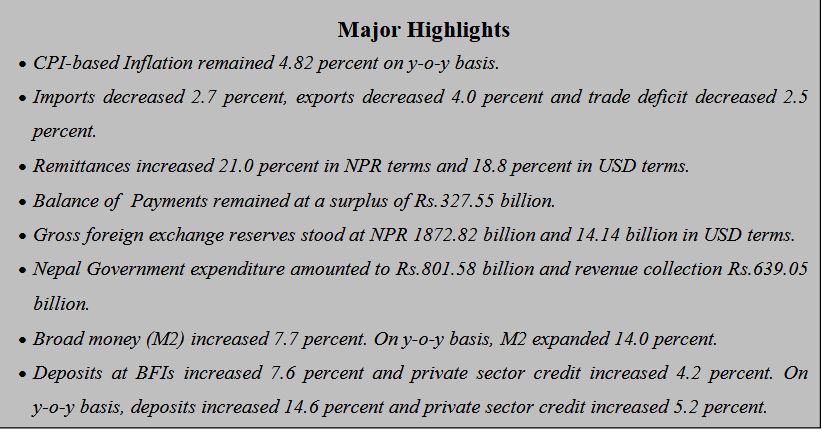
Kathmandu, April 4: The Nepal Rastra Bank, the central bank of Nepal, has stated that the remittance inflows increased 21.0 percent to Rs.961.22 billion in the first eight months of current fiscal year 2023/24.
According to a report “Current Macroeconomic and Financial Situation of Nepal”, the remittance has increased by 25.3 percent in the same period of the previous year. In the US Dollar terms,
remittance inflows increased 18.8 percent to 7.24 billion in the review period compared to an increase of 14.8 percent in the same period of the previous year.
In the review period, the number of Nepali workers, both institutional and individual, taking first- time approval for foreign employment stands at 286,932 and taking approval for renew entry stands at 184,278. In the previous year, such numbers were 351,761 and 192,559 respectively.
Net transfer increased 18.9 percent to Rs.1041.96 billion in the review period. Such a transfer had increased 23.9 percent in the same period of the previous year.
Current Account and Balance of Payments
The current account remained at a surplus of Rs.166.87 billion in the review period against a deficit of Rs.55.28 billion in the same period of the previous year. In the US Dollar terms, the current
account registered a surplus of 1.25 billion in the review period against a deficit of 429.3 million in the same period last year.
In the review period, capital transfer decreased 30.2 percent to Rs.3.89 billion and net foreign direct investment (FDI) remained a positive of Rs.5.63 billion. In the same period of the previous year, capital transfer amounted to Rs.5.58 billion and net FDI amounted to Rs.1.17 billion.
Balance of Payments (BOP) remained at a surplus of Rs.327.55 billion in the review period against a surplus of Rs.142 billion in the same period of the previous year. In the US Dollar terms, the
BOP remained at a surplus of 2.46 billion in the review period against a surplus of 1.08 billion in the same period of the previous year.
Foreign Exchange Reserves
Gross foreign exchange reserves increased 21.7 percent to Rs.1872.82 billion in mid-March 2024 from Rs.1539.36 billion in mid-July 2023. In the US dollar terms, the gross foreign exchange reserves increased 20.8 percent to 14.14 billion in mid-March 2024 from 11.71 billion in mid-July 2023.
Of the total foreign exchange reserves, reserves held by NRB increased 22.2 percent to Rs.1644.06 billion in mid-March 2024 from Rs.1345.78 billion in mid-July 2023. Reserves held by banks and financial institutions (except NRB) increased 18.2 percent to Rs.228.76 billion in mid-March 2024 from Rs.193.59 billion in mid-July 2023. The share of Indian currency in total reserves stood at 22.1 percent in mid-March 2024.
Foreign Exchange Adequacy Indicators
Based on the imports of eight months of 2023/24, the foreign exchange reserves of the banking sector is sufficient to cover the prospective merchandise imports of 14.8 months, and merchandise
and services imports of 12.4 months.
The ratio of reserves-to-GDP, reserves-to-imports and reserves-to-M2 stood at 34.8 percent, 103.1 percent and 28.2 percent respectively in mid-March 2024. Such ratios were 28.6 percent, 83.0 percent and 25.0 percent respectively in mid-July 2023.
Merchandise Trade
During the review period, merchandise exports decreased 4.0 percent to Rs.100.62 billion compared to a decrease of 29.1 percent in the same period of the previous year. Destination-wise, exports to India decreased 7.7 percent whereas exports to China and other countries increased 275.5 percent and 0.3 percent respectively. Exports of zinc sheet, particle board, juice, readymade garments, polyster and thread among others increased whereas exports of palm oil, soyabean oil, cardamom, woolen carpet, brans among others decreased.
In the review period, merchandise imports decreased 2.7 percent to Rs.1030.22 billion compared to a decrease of 19.1 percent a year ago. Destination-wise, imports from India and other countries
decreased 2.8 percent and 22.9 percent respectively while imports from China increased 33.7 percent. Imports of readymade garments, transport equipment, vehicle and other vehicle spare parts, aircraft spare parts, electrical equipment, textiles among others increased whereas imports of crude soyabean oil, gold, petroleum products, crude palm oil, rice/paddy among others decreased.
Based on customs points, exports from Bhairahawa, Dry Port, Jaleswor, Kanchanpur, Krishnanagar, Mechi, Rasuwa and Tatopani increased whereas exports from all the other major
customs points decreased in the review period. On the import side, imports from Bhairahawa, Dry Port, Jaleshwor, Kanchanpur, Krishnanagar, Nepalgunj, Rasuwa and Tatopani Customs Offices
increased whereas imports from all the other major customs points decreased in the review period.
Total trade deficit decreased 2.5 percent to Rs.929.61 billion during the review period. Such a deficit had decreased 17.9 percent in the corresponding period of the previous year. The export-
import ratio decreased to 9.8 percent in the review period from 9.9 percent in the corresponding period of the previous year.
During the review period, merchandise imports from India against payment in convertible foreign currency amounted Rs. 98.29 billion. Such amount was Rs.85.12 billion in the same period of the
previous year.
Composition of Foreign Trade
As per the Broad Economic Categories (BEC), the intermediate and final consumption goods accounted for 57.0 percent and 42.8 percent of the total exports respectively, whereas the ratio of
capital goods in total exports remained negligible at 0.3 percent in the review period. In the same period of the previous year, the ratio of intermediate, capital and final consumption goods remained 54.5 percent, 0.5 percent and 45.0 percent of total exports respectively.
On the imports side, the share of intermediate goods remained 49.5 percent, capital goods 8.9 percent and final consumption goods 41.6 percent in the review period. Such ratios were 53.3
percent, 8.5 percent and 38.2 percent respectively in the same period of the previous year.
FULL TEXT