

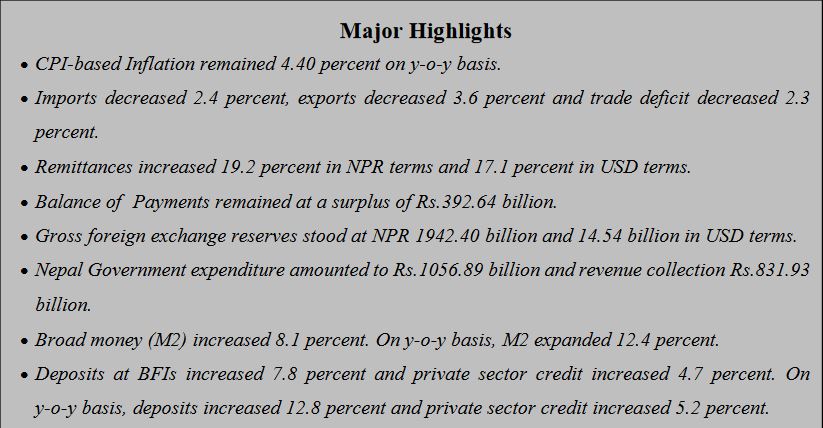
Kathmandu, June 10: Nepal Rastra Bank, the central bank of Nepal, has said that remittances have increased 19.2 percent in NPR terms and 17.1 percent in USD terms in the 10 months period of the current fiscal year 2024/25.
According to a report titled “Current Macroeconomic and Financial Situation of Nepal” published today, the NRB has said that the emittance inflows have stood at Rs.1198.6 billion in the review period compared to an increase of 23.4 percent in the same period of the previous year. In the US Dollar terms, remittance inflows increased 17.1 percent to 9.02 billion in the review period compared to an increase of 13.4 percent in the same period of the previous year.
In the review period, the number of Nepali workers, both institutional and individual, taking first-time approval for foreign employment stands at 374,887 and taking approval for renew entry stands at 237,893. In the previous year, such numbers were 421,279 and 238,976 respectively. Net transfer increased 17.2 percent to Rs.1301.72 billion in the review period. Such a transfer had
increased 22.5 percent in the same period of the previous year.
Composition of Foreign Trade
As per the Broad Economic Categories (BEC), the intermediate and final consumption goods accounted for 56.6 percent and 42.8 percent of the total exports respectively, whereas the ratio of
capital goods in total exports remained negligible at 0.6 percent in the review period. In the same period of the previous year, the ratio of intermediate, capital and final consumption goods remained 54.9 percent, 0.6 percent and 44.5 percent of total exports respectively.
On the imports side, the share of intermediate goods remained 48.9 percent, capital goods 9.3 percent and final consumption goods 41.8 percent in the review period. Such ratios were 53.2
percent, 8.4 percent and 38.4 percent respectively in the same period of the previous year.
Current Account and Balance of Payments
The current account remained at a surplus of Rs.193.25 billion in the review period against a deficit of Rs.63.74 billion in the same period of the previous year. In the US Dollar terms, the current
account registered a surplus of 1.45 billion in the review period against a deficit of 493.6 million in the same period last year.
In the review period, capital transfer decreased 17.2 percent to Rs.5.26 billion and net foreign direct investment (FDI) remained a positive of Rs.6.98 billion. In the same period of the previous year, capital transfer amounted to Rs.6.36 billion and net FDI amounted to Rs.4.36 billion.
Balance of Payments (BOP) remained at a surplus of Rs.392.64 billion in the review period against a surplus of Rs.209.49 billion in the same period of the previous year. In the US Dollar terms, the BOP remained at a surplus of 2.95 billion in the review period against a surplus of 1.59 billion in the same period of the previous year.
Foreign Exchange Reserves
Gross foreign exchange reserves increased 26.2 percent to Rs.1942.4 billion in mid-May 2024 from Rs.1539.36 billion in mid-July 2023. In the US dollar terms, the gross foreign exchange reserves increased 24.2 percent to 14.54 billion in mid-May 2024 from 11.71 billion in mid- July 2023.
Of the total foreign exchange reserves, reserves held by NRB increased 28 percent to Rs.1722.02 billion in mid-May 2024 from Rs.1345.78 billion in mid-July 2023. Reserves held by banks and
financial institutions (except NRB) increased 13.8 percent to Rs.220.38 billion in mid-May 2024 from Rs.193.59 billion in mid-July 2023. The share of Indian currency in total reserves stood at
22.1 percent in mid-May 2024.
Foreign Exchange Adequacy Indicators
Based on the imports of ten months of 2023/24, the foreign exchange reserves of the banking sector is sufficient to cover the prospective merchandise imports of 15.1 months, and merchandise and services imports of 12.6 months.
The ratio of reserves-to-GDP, reserves-to-imports and reserves- to-M2 stood at 34 percent, 105.3 percent and 29.2 percent respectively in mid-May 2024. Such ratios were 28.8 percent, 83.0 percent and 25.0 percent respectively in mid-July 2023.
Nepal Government Expenditure and Revenue
According to Ministry of Finance, Financial Comptroller General Office (FCGO), the total expenditure of the Nepal Government stood at Rs.1056.89 billion during the ten months of 2023/24.
Compared to a growth of 15.3 percent in the last fiscal year, government expenditure increased by 0.9 percent in the review period. The recurrent expenditure, capital expenditure and financial expenditure amounted to Rs.752.56 billion, Rs.111.88 billion and Rs.192.45 billion respectively in the review period.
In the review period, total revenue mobilization of Nepal Government (including the amount to be transferred to provincial and local governments) stood at Rs.831.93 billion. Revenue mobilization recorded a growth of 10.0 percent in the review period in constrast to decrease of 12.6 percent in the same period of last fiscal year. The tax revenue amounted Rs.746.83 billion and non tax revenue Rs.85.10 billion in the review period.
Credit Disbursements
Private sector credit from BFIs increased Rs.225.24 billion (4.7 percent) in the review period compared to an increment of Rs.153.17 billion (3.3 percent) in the corresponding period of previous year. On y-o-y basis, credit to the private sector from BFIs increased 5.2 percent in mid-May 2024.
The shares of private sector credit from BFIs to non-financial corporation and household stand at 63.7 percent and 36.3 percent respectively in mid-May 2024. Such shares were 63.9 percent and 36.1 percent a year ago.
In the review period, private sector credit from commercial banks, development banks and finance companies increased 4.7 percent, 3.9 percent and 6.3 percent respectively.
In the review period, out of the total outstanding credit of the BFIs, 12.1 percent is against the collateral of current assets (such as agricultural and non-agricultural products) and 68.5 percent
against land and building. Such ratios were 12.1 percent and 67.3 percent respectively a year ago.
In the review period, outstanding loan of BFIs to the agriculture sector increased 0.4 percent, production sector 8.1 percent, construction sector 9.8 percent, transportation, communication and
public sector 12.0 percent, wholesale and retail sector 3.1 percent, service industry sector 5.0 percent and consumable sector 5.6 percent.
In the review period, term loan extended by BFIs increased 18.8 percent, cash credit loan 25.6 percent, real estate loan (including residential personal home loan) 6.8 percent, and margin nature
loan 12.6 percent whereas overdraft loan decreased 44.7 percent (mainly due to reclassification of loan from the last year), trust receipt (import) loan decreased 0.5 percent and hire purchase loan
decreased 21.8 percent.
FULL TEXT