

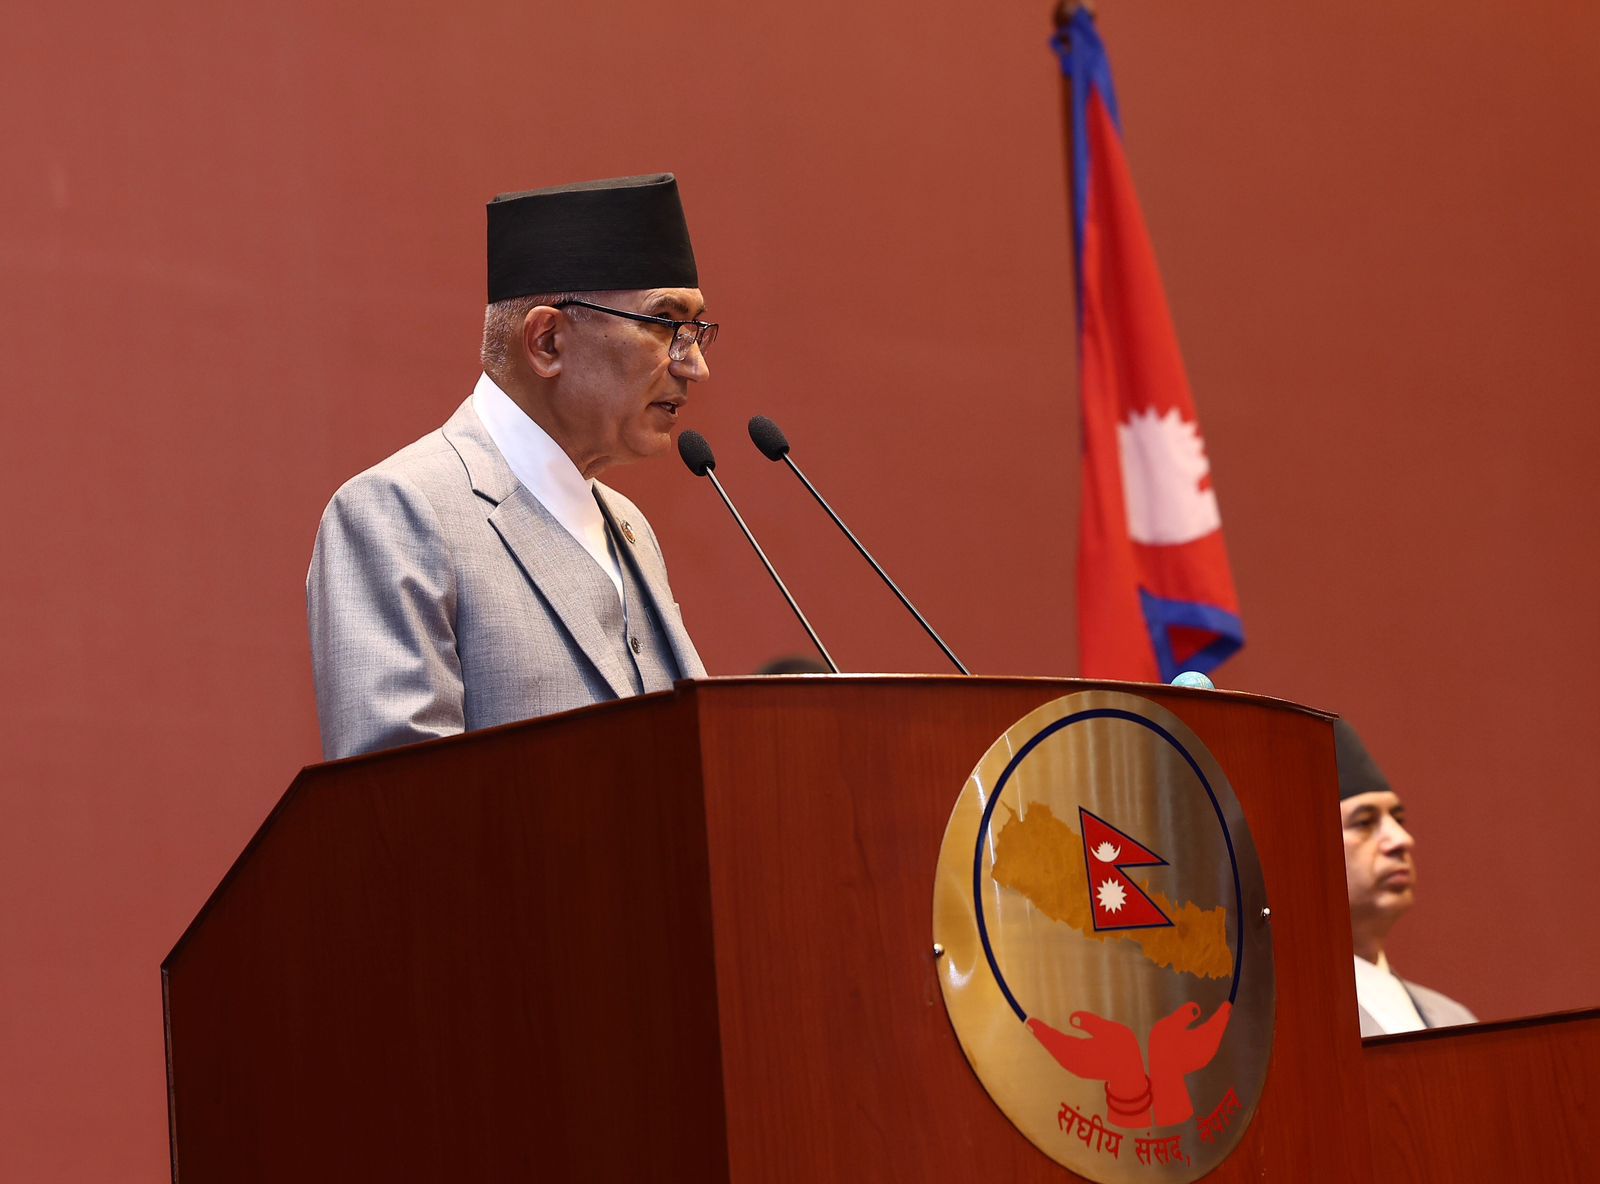
Kathmandu, May 29: The Economic Survey has predicted that the overall, recent economic activities and developments have further pushed the country’s economy into a more challenging situation. The Survey Report, presented before the joint session of Federal Parliament, has further said that although there is an estimate of economic growth, consumer inflation remains close to the upper limit.
Minister of Finance Bishnu Prasad Paudel tabled the the report in the parliament.
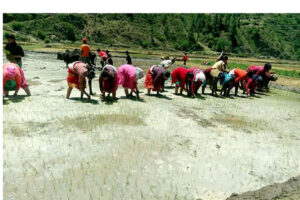
“In recent years, the contribution of the agriculture sector to the Gross Domestic Product (GDP) had been declining, but from the fiscal year 2079/80 (2022/23), this contribution has started to increase again. Agricultural production has also increased. The share of consumption in the GDP remains high, indicating that economic growth is driven by consumption.”
Executive Summary of the Report
1. Due to improving global economic activities, the global economy is projected to grow at a slower pace in 2025. In 2024, the global economy grew by 3.3%. However, due to global trade tensions, reduced investment, and disruptions in supply chains, the projected growth for 2025 is expected to be 2.8%.
2. With declining inflation in developed, emerging, and developing economies, overall inflationary pressure is expected to ease in 2025. Due to falling prices of petroleum products and food items, a decrease in the prices of essential goods is anticipated.
3. Owing to growth in sectors like agriculture, electricity, gas, water supply, and storage, Nepal’s economic growth in the current fiscal year is estimated to be 4.61%. The previous fiscal year’s economic growth was 3.67%. The size of Nepal’s economy in the current fiscal year is projected to reach Rs 61 Kharba 7 Arba.
4. Among the provinces, Gandaki Province is projected to have the highest economic growth rate of 5.51%, while Sudurpashchim Province is expected to have the lowest at 3.32%. Other projections include: Koshi Province at 3.36%, Madhesh Province at 4.50%, Bagmati Province at 5.18%, Lumbini Province at 4.70%, and Karnali Province at 4.74%.
5. In the current fiscal year, agricultural sector production is expected to grow by 3.28%, and non-agricultural sector production by 4.28%. In the previous fiscal year, agriculture grew by 3.35% and the non-agriculture sector by 3.36%. Food production is estimated to grow by 4.04%.
6. The service sector has the highest contribution to total gross domestic product (GDP). In the current fiscal year, agriculture is expected to contribute 25.16%, industry 12.83%, and services 62.01% to the GDP. In the previous fiscal year, these contributions were 24.71%, 12.91%, and 62.38%, respectively.
7. Consumption constitutes a major portion of total GDP. In the previous fiscal year, consumption accounted for 93.78% of total GDP, and in the current fiscal year, it is expected to be 93.45%. Gross domestic saving, which was 6.22% in the previous year, is projected to rise to 6.55% this fiscal year.
8. In the fiscal year 2080/81 (2023/24), total fixed capital investment increased by 5.2 percent. In the current fiscal year, it is estimated to grow by 5.8 percent and reach Rs 14 Kharba 70 Arba 12 Crore. Out of the total fixed capital investment, the public sector accounts for 39.1 percent and the private sector for 60.9 percent.
9. In the fiscal year 2081/82 (2024/25), the Gross National Income (GNI) at current prices is estimated to grow by 5.8 percent and reach Rs 206,424. In the fiscal year 2080/81, the per capita Gross National Income was 1,467 USD, and in the current fiscal year, it is estimated to reach 1,517 USD.
10. Due to the decline in crude oil prices in the international market and a decrease in inflation in neighboring countries, the consumer price inflation as of Falgun (mid-February to mid-March) in the current fiscal year fell to 4.72 percent. During the same period in the previous fiscal year, the inflation rate was 6.08 percent.
11. In the fiscal year 2080/81, total revenue collection of the three levels of government increased by 10.4 percent, reaching Rs 11 Kharba 50 Arba 99 Crore. Of the total collected revenue, 92.0 percent was collected by the federal government, while provincial and local governments collected 8.0 percent.
12. In the fiscal year 2080/81, total expenditure of the three tiers of government decreased by 0.9 percent, amounting to Rs 16 Kharba 40 Arba 68 Crore. Of the total expenditure, the federal government accounted for 64.2 percent, provincial governments for 9.9 percent, and local governments for 25.9 percent.
13. In the fiscal year 2080/81, of the total consolidated government expenditure, the share of recurrent expenditure was 56.1 percent, capital expenditure was 27.3 percent, and financial arrangements and liability payments constituted 16.6 percent.
14. In the fiscal year 2080/81, the federal government’s fiscal deficit was 2.53 percent of the Gross Domestic Product (GDP), while the primary deficit was 1.09 percent of GDP.
15. In the fiscal year 2080/81, federal revenue increased by 11.4 percent, reaching Rs 9 Kharba 29 Arba 5 Crore. Meanwhile, federal expenditure decreased by 2.0 percent, amounting to Rs 13 Kharba 93 Arba 40 Crore.
16. In FY 2080/81, federal expenditure, federal revenue, and public debt accounted for 24.41%, 16.27%, and 42.64% of Gross Domestic Product (GDP), respectively.
17. By the end of Falgun (mid-March 2025) of the current fiscal year, a total of Rs 3 Kharba 25 Arba 46 Crore was transferred to provincial and local governments. This includes Rs 2 Kharba 39 Arba 76 Crore as fiscal equalization, conditional, special, and complementary grants, and Rs 85 Arba 70 Crore as revenue-sharing funds.
18. As of Falgun in FY 2080/81, the federal government had a fiscal deficit of Rs 70 Arba 36 Crore. In the same period of the current fiscal year, the deficit stands at Rs 16 Arba 19 Crore.
19. By Falgun of the current fiscal year, federal expenditure increased by 4.7% compared to the same period last fiscal year and reached Rs 8 Kharba 39 Arba. Federal revenue increased by 12.6%, reaching Rs 5 Kharba 61 Arba 93 Crore.
20. As of Falgun of the current fiscal year, the government mobilized Rs 3 Kharba 34 Arba 62 Crore in public debt, including both domestic and external loans. During the same period, total foreign aid (grants and loans) increased by 119.4%, reaching Rs 2 Kharba 22 Arba.
21. By the end of Falgun 2081, internal loans totaled Rs 13 Kharba 15 Arba 58 Crore, and external loans stood at Rs 13 Kharba 60 Arba 46 Crore, making the total public debt Rs 26 Kharba 76 Arba 4 crore.
22. By Falgun of the current fiscal year, total goods exports increased by 57.2% to Rs 1 Kharba 58 Arba 17 crore, and imports rose by 11.2% to Rs 11 Kharba 45 Arba 57 crore. During the same period last fiscal year, exports and imports had declined by 4.0% and 2.7%, respectively. The total trade deficit increased by 6.2%, reaching Rs 9 Kharba 87 Arba 39 crore.
23. The number of labor approvals for foreign employment exceeded 640,000 by Falgun 2081. In the same period of the current fiscal year, 317,063 individuals received approval for foreign employment. During this period, remittance inflows increased by 9.4%, reaching Rs 10 Kharba 51 Arba 77 crore (equivalent to USD 7.74 billion).
24. Between August 2024 and March 2025, Nepal received 798,510 tourists—an increase of 1.7% compared to 785,362 tourists in the same period of the previous fiscal year. During this period, earnings from tourism rose by 9.7%, reaching Rs 56 Arba 70 crore, compared to Rs 51 Arba 69 crore in the previous year. In 2024, the average stay of tourists was 13.3 days, and the average spending per tourist per day was USD 40.8.
25. By Falgun of the current fiscal year, the current account recorded a surplus of Rs 1 Kharba 80 Arba 8 crore, and the balance of payments recorded a surplus of Rs 3 Kharba 10 Arba 37 crore. In the same period last fiscal year, the current account had a surplus of Rs 1 Kharba 67 Arba 45 crore and the balance of payments surplus was Rs 3 Kharba 27 Arba 55 crore.
26. By the end of Falgun 2081, total foreign exchange reserves increased by 18.0% and reached Rs 24 Kharba 9 Arba 25 crore, up from Rs 20 Kharba 41 Arba 10 crore at the end of Ashar 2081. These reserves are sufficient to cover 17.2 months of merchandise imports and 14.3 months of total imports of goods and services. In USD terms, the reserve stood at USD 17.27 billion by the end of Falgun.
27. As of Falgun 2081, there were 107 banks and financial institutions operating, including 20 commercial banks, 17 development banks, 17 finance companies, 52 microfinance institutions, and 1 infrastructure development bank. Commercial banks have branches in all local levels across the country.
28. With the expansion of the branch network of banks and financial institutions, financial access has also improved. By Falgun 2081:
* There were 5.83 million deposit accounts,
* 1.937 million loan accounts,
* 26.757 million mobile banking users, and
* 2.141 million internet banking users.
29. Based on the number of branches of banks and financial institutions, the average population per branch stood at 2,527 in Falgun 2081, slightly up from 2,524 in Ashar 2081.
30. Based on monetary aggregates, by the end of Falgun 2081 BS (March 2025), total deposits in banks and financial institutions increased by 9.5% to Rs 67 Kharba 29 Arba 62 crores, compared to Rs 61 Kharba 45 Arba 88 crores in Falgun 2080 BS.
31. Similarly, total credit disbursed by banks and financial institutions rose by 7.7% to Rs 53 Kharba 78 Arba 78 crores by Falgun 2081 BS, from Rs 49 Kharba 96 Arba 53 crores in Falgun 2080 BS.
32. In Falgun 2081 BS, the average weighted interest rates on deposits and credit provided by commercial banks were 4.54% and 8.40%, respectively. In Falgun 2080 BS, these rates were 6.74% and 10.78%, respectively.
33. The average ratio of non-performing loans (NPL) of banks and financial institutions increased from 3.73% in Poush 2080 BS to 4.92% in Poush 2081 BS.
34. Based on monetary aggregates, broad money supply increased by 9.9% while narrow money supply rose by 3.3% by Falgun 2081 BS. These rates were 14.2% and 3.0%, respectively, in Falgun 2080 BS.
35. The NEPSE index reached 2,736.49 by the end of Falgun 2081 BS, up from 2,108.72 in Falgun 2080 BS. The total market capitalization rose by 37.1% from NPR 33 trillion 14 billion to NPR 45 trillion 43 billion during the same period.
36. As of Falgun 2081 BS, 44.17% of the population had access to life insurance. This was 43.27% in Asadh 2081 BS.
37. Revenue collection until Falgun of the current fiscal year increased by 10.6% compared to the same period last year, reaching NPR 1 trillion 38 billion 5 crores, compared to NPR 1 trillion 24 billion 86 crores last year.
38. Cereal crops continue to have the largest share in agricultural production and area. In the current fiscal year, cereals account for 45.52%, vegetables 18.59%, cash crops 15.15%, industrial crops 11.47%, fruits 5.93%, and other crops 3.34% of total agricultural production.
39. In FY 2081/82 BS, among the cultivated areas, cereal crops covered 70.96%, cash crops 9.98%, vegetables 6.96%, pulses 5.61%, and other crops 6.49%.
40. By Falgun 2081 BS, irrigation facilities had been expanded to 1,573,559 hectares of land.
41. By the same period, 262,930 metric tons of fertilizers were imported, and including existing stock, 285,700 metric tons of subsidized fertilizers were distributed, with 81,500 metric tons in stock.
42. Forests covered 63,99,341 hectares and shrubland 3,97,916 hectares, accounting for 43.38% and 2.70% respectively, totaling 46.08% of the country’s area.
43. The Department of Industry approved foreign investments worth Rs 32 Arba 48 crores, and the Investment Board Nepal approved Rs 15 Arba 18 crores, totaling Rs 47 Arba 66 crores by Falgun 2081 BS. The approved foreign investment during the same period of the previous year was Rs 3 Arba 12 crores.
44. In Falgun of the current fiscal year, foreign investment worth Rs 44 Arba 66 crores was approved, compared to Rs 29 Arba 13 crores in the same period last year. The approved investment is expected to generate 339,675 jobs.
45. The National Food Security Reserve held 10,510 metric tons of food grains, and the SAARC Food Bank had 18,510 metric tons. Storage capacity for petroleum products (petrol, diesel, kerosene, ATF) was 1,02,164 kiloliters.
46. By Falgun 2081 BS, the total installed electricity capacity was 3,602 megawatts. Access to electricity reached 99.0% of the population. During this period, 1,775 GWh was exported and 929 GWh was imported.
47. As of Falgun 2081 BS, 20,79,004 workers were enrolled in the social security scheme, including 568,188 in the formal sector, 1,510,063 in foreign employment, 446 in the informal sector, and 307 in the self-employed sector. Additionally, 20,244 employers were registered.
48. Access to information technology reached across all sectors. Broadband internet service reached 6,566 local centers. Internet penetration reached 144.23%, and digital television services reached 72.0% of households.
49. As of Falgun 2081 BS, the strategic road network included 19,163 km of blacktopped roads, 8,204 km gravel roads, and 8,765 km earthen roads, totaling 36,132 km.
50. The number of public health institutions reached 8,746, including 345 hospitals, 149 primary health centers, 3,742 health posts, and 4,510 other facilities. There were 1.1 doctors and 2.86 nurses per 1,000 people.
51. As of Falgun 2081 BS, 37,984 impoverished citizens received free treatment for heart, cancer, and kidney diseases. 49.2% of the total population accessed health services.
52. In the academic year 2081 BS, the net enrollment rate was 94.1% in basic education (grades 1–8) and 55.8% in secondary education (grades 9–12). The pass rates were 86.5% in grade 8, 66.9% in grade 10, and 40.6% in grade 12.
53. Access to basic drinking water reached 96.85% of the population; safe drinking water (medium-high quality) reached 28.50%; and basic sanitation reached 95.5%.
54. By Falgun 2081 BS, 3.76 million people were beneficiaries of the social security allowance. In the same period of the previous year, the number was 3.82 million.
55. Biometric and demographic data collection was completed for 16.94 million citizens, and national identity cards were issued to 2.21 million individuals.
56. Efforts to remove Nepal from the FATF grey list were intensified in 2082 BS, focusing on risk-based supervision, enhanced AML/CFT implementation, and prioritizing financial and non-financial institution monitoring.
57. The share of women in judiciary increased from 12.0% in Asadh 2065 BS to 29.2% by Falgun 2081 BS, including judges and female employees in government and public offices.
58. Diplomatic relations were established with 183 countries by Falgun 2081 BS.
59. In 2024, Nepal for the first time met the indicators of the Composite Revenue Index, a criterion for graduating from Least Developed Country (LDC) status.
60. In the Productive Capacity Index (PCI), Nepal scored an average of 40.4, compared to 30.9 for other least developed countries and 46.8 for developing countries. #economicsurvey #nepal #economy
Read Full Report