

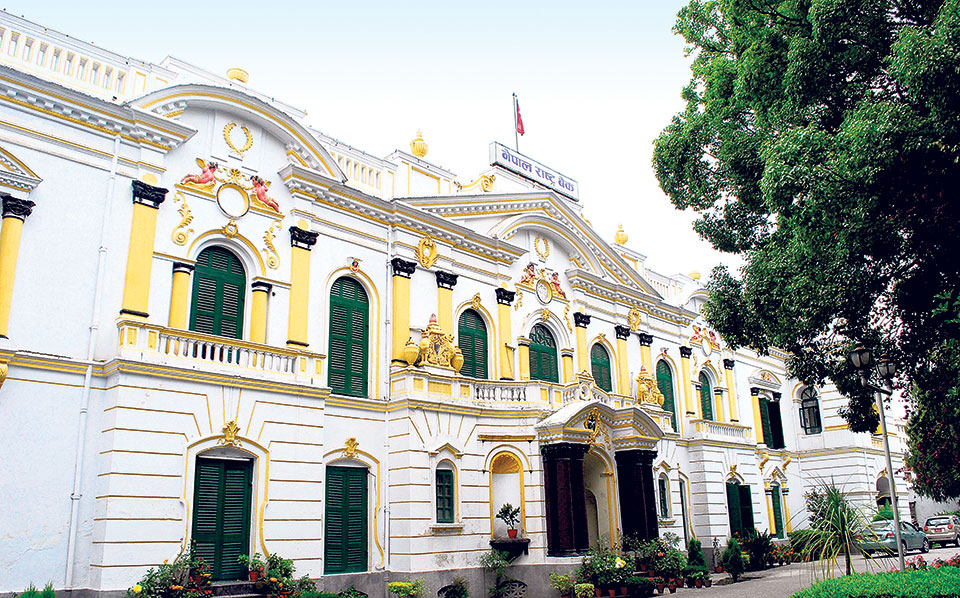
Kathmandu, June 11: The Nepal Rastra Bank (NRB), the central bank of Nepal, has stated that during the ten months of current fiscal year 2081/82 (2024/25), remittance inflows increased 13.2 percent to Rs.1356.61 billion in the review period compared to an increase of 16.9 percent in the same period of the previous year.
According to NRB’s “Current Macroeconomic and Financial Situation of Nepal”, during mid-April to mid-May 2025 (Baisakh, 2082), remittance inflows stood at Rs.165.30 billion. In the same period of previous year, such inflows amounted to Rs. 115.99 billion.
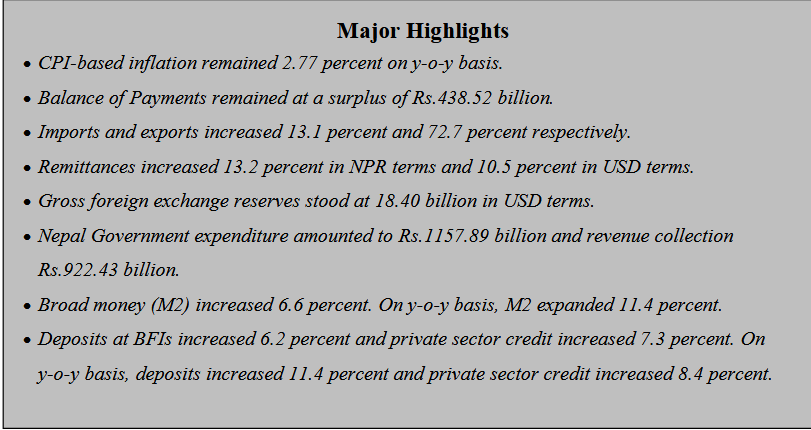
In the US Dollar terms, remittance inflows increased 10.5 percent to 9.96 billion in the review period compared to an increase of 14.8 percent in the same period of the previous year. Net secondary income (net transfer) reached Rs. 1479.08 billion in the review period compared to Rs.1301.75 billion in the same period of the previous year.
In the review period, the number of Nepali workers, both institutional and individual, taking first- time approval for foreign employment stands at 405,610 and taking approval for renew entry stands at 280,314. In the previous year, such numbers were 373,307 and 236,398 respectively, the NRB has said.
Current Account and Balance of Payments
The current account remained at a surplus of Rs.255.93 billion in the review period compared to a surplus of Rs. 193.31 billion in the same period of the previous year. In the US Dollar terms, the current account registered a surplus of 1.89 billion in the review period against a surplus of 1.45 billion in the same period last year.
In the review period, net capital transfer amounted to Rs.8.48 billion. In the same period of the previous year, such transfer amounted to Rs.5.26 billion. Similarly, in the review period, Rs.10.6 billion foreign direct investment (equity only) was received. In the same period of the previous year, foreign direct investment inflow (equity only) amounted to Rs.7.05 billion.
Balance of Payments (BOP) remained at a surplus of Rs.438.52 billion in the review period compared to a surplus of Rs.392.64 billion in the same period of the previous year. In the US Dollar terms, the BOP remained at a surplus of 3.23 billion in the review period compared to a surplus of 2.95 billion in the same period of the previous year.
Foreign Exchange Reserves
Gross foreign exchange reserves increased 23.1 percent to Rs.2512.95 billion in mid-May 2025 from Rs.2041.10 billion in mid-July 2024. In the US dollar terms, the gross foreign exchange reserves increased 20.5 percent to 18.40 billion in mid-May 2025 from 15.27 billion in mid- July 2024.
Of the total foreign exchange reserves, the reserves held by NRB increased 19.6 percent to Rs.2211.11 billion in mid-May 2025 from Rs.1848.55 billion in mid-July 2024. Reserves held by banks and financial institutions (except NRB) increased 56.8 percent to Rs.301.83 billion in mid-May 2025 from Rs.192.55 billion in mid-July 2024. The share of Indian currency in total reserves stood at 21.2 percent in mid-May 2025.
Foreign Exchange Adequacy Indicators
Based on the imports of ten months of 2024/25, the foreign exchange reserves of the banking sector is sufficient to cover the prospective merchandise imports of 17.4 months, and merchandise and services imports of 14.6 months.
The ratio of reserves-to-GDP, reserves-to-imports and reserves- to-M2 stood at 41.1 percent, 121.4 percent and 33.8 percent respectively in mid-May 2025. Such ratios were 35.8 percent, 108.6 percent and 29.3 percent respectively in mid-July 2024.
Consumer Price Inflation (CPI)
The y-o-y consumer price inflation stood at 2.77 percent in mid-May 2025 compared to 4.40 percent a year ago. Food and beverage inflation stood at 1.52 percent whereas non- food and service inflation stood at 3.45 percent in the review month. During the same period in the previous year, the price indices of these groups had increased 6.41 percent and 3.09 percent, respectively.
Under the food and beverage category, y-o-y price index of ghee & oil sub-category increased 11.08 percent, fruit 6.15 percent, pulses & legumes 5.17 percent and non-alcoholic drinks 4.70 percent while y-o-y price index of vegetable sub-category decreased 8.11 percent, spices 2.20 percent and meat & fish 0.48 percent.
Read full report