

Kathmandu, July 8: Nepal Rastra Bank, the central bank of Nepal, has said that during the eleven months of FY 2024/25, remittance inflows increased 15.5 percent to Rs.1532.93 billion in the review period compared to an increase of 17.2 percent in the same period of the previous year. During mid-May to mid-June 2025 (Jestha month), remittance inflows stood at Rs. 176.32 billion. In the same period, such inflows were Rs. 128.91 billion.
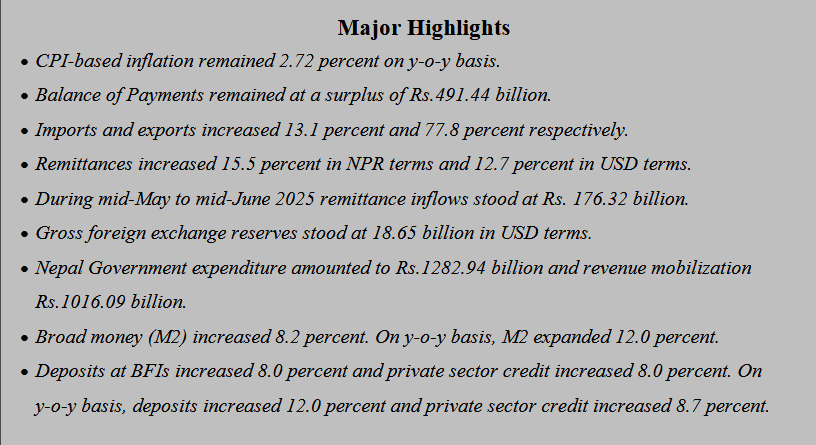
According to a report “Current Macroeconomic and Financial Situation of Nepal” (Based on Eleven Months Data Ending Mid-June 2024/25), in the US Dollar terms, remittance inflows increased 12.7 percent to 11.25 billion in the review period compared to an increase of 15.2 percent in the same period of the previous year.
Net secondary income (net transfer) reached Rs.1668.30 billion in the review period compared to Rs.1443.10 billion in the same period of the previous year. The number of Nepali workers, both institutional and individual, taking first-time approval for foreign employment stands at 452,324 and taking approval for renew entry stands at 308,067. In the previous year, such numbers were 421,356 and 261,210 respectively.
Current Account and Balance of Payments
The current account remained at a surplus of Rs. 307.31 billion in the review period compared to a surplus of Rs.200.38 billion in the same period of the previous year. In the US Dollar terms, the current account registered a surplus of 2.26 billion in the review period against a surplus of 1.51 billion in the same period last year.
In the review period, net capital transfer amounted to Rs.8.96 billion. In the same period of the previous year, such transfer amounted to Rs.5.46 billion. Similarly, in the review period, Rs.11.09 billion foreign direct investment (equity only) was received. In the same period of the previous year, foreign direct investment inflow (equity only) amounted to Rs.8.24 billion.
Balance of Payments (BOP) remained at a surplus of Rs.491.44 billion in the review period compared to a surplus of Rs.425.67 billion in the same period of the previous year. In the US Dollar terms, the BOP remained at a surplus of 3.62 billion in the review period compared to a surplus of 3.2 billion in the same period of the previous year.
Foreign Exchange Reserves
Gross foreign exchange reserves increased 25.9 percent to Rs.2569.38 billion in mid-June 2025 from Rs.2041.10 billion in mid-July 2024. In the US dollar terms, the gross foreign exchange reserves increased 22.2 percent to 18.65 billion in mid-June 2025 from 15.27 billion in mid-July 2024.
Of the total foreign exchange reserves, the reserves held by NRB increased 23.0 percent to Rs.2274.47 billion in mid-June 2025 from Rs.1848.55 billion in mid-July 2024. Reserves held by banks and financial institutions (except NRB) increased 53.2 percent to Rs.294.92 billion in mid-June 2025 from Rs.192.55 billion in mid-July 2024. The share of Indian currency in total reserves stood at 20.5 percent in mid-June 2025.
Foreign Exchange Adequacy Indicators
Based on the imports of eleven months of 2024/25, the foreign exchange reserves of the banking sector is sufficient to cover the prospective merchandise imports of 17.6 months, and merchandise and services imports of 14.7 months.
The ratio of reserves-to-GDP, reserves-to-imports and reserves-to-M2 stood at 42.1 percent, 122.9 percent, and 34.1 percent respectively in mid-June 2025. Such ratios were 35.8 percent, 108.6 percent, and 29.3 percent respectively in mid-July 2024.
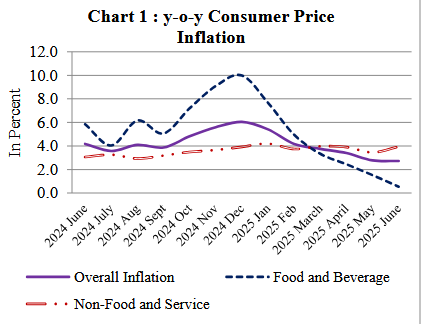
Consumer Price Inflation
The y-o-y consumer price inflation stood at 2.72 percent in mid-June 2025 compared to 4.17 percent a year ago. Food and beverage inflation stood at 0.54 percent whereas non-food and service inflation stood at 3.94 percent in the review month. During the same period in the previous year, the price indices of these groups had increased 5.85 percent and 3.07 percent, respectively.
Under the food and beverage category, y-o-y price index of ghee & oil sub-category increased 10.06 percent, non-alcoholic drinks 5.13 percent, fruit 3.51 percent and pulses & legumes 2.85 percent while y-o-y price index of vegetable sub-category decreased 7.04 percent, spices 3.06 percent and meat & fish 2.91 percent.
Under the non-food and services category, y-o-y price index of miscellaneous goods & services sub-category increased 9.43 percent, clothes and footwear 6.82 percent, education 5.88 percent, furnishing & household equipment 5.06 percent, and tobacco products 4.68 percent.
During the review month, y-o-y price index in rural areas increased 2.90 percent, while in urban areas, it rose 2.66 percent.
Based on provinces, in the review month, y-o-y consumer price inflation in Koshi Province is 4.18 percent, Madhesh Province 2.52 percent, Bagmati Province 2.29 percent, Gandaki Province 1.75 percent, Lumbini Province 2.39 percent, Karnali Province 2.54 percent, and Sudurpashchim Province 3.86 percent.
In the review month, y-o-y consumer price inflation in the Kathmandu Valley, Terai, Hill, and Mountain region stood at 2.73 percent, 2.58 percent, 2.48 percent, and 4.18 percent respectively.
Merchandise Trade
During the eleven months of 2024/25, merchandise exports increased 77.8 percent to Rs. 247.57 billion against a decrease of 3.0 percent in the same period of the previous year. Destination-wise, exports to India, China, and other countries increased 112.6 percent, 3.0 percent, and 4.4 percent respectively. Exports of soyabean oil, polyster yarn and thread, jute goods, tea, and rosin among others increased whereas exports of palm oil, zinc sheet, juice, readymade garments, and cardamom among others decreased in the review period.
During the eleven months of 2024/25, mercandise imports increased 13.1 percent to Rs.1644.80 billion against a decline of 1.8 percent a year ago. Destination-wise, imports from India, China, and other countries increased 7.6 percent, 15.3 percent, and 29.5 percent respectively. Imports of crude soyabean oil, rice/paddy, transport equipment, vehicle and spare parts, edible oil, and sponge iron among others increased whereas imports of petroleum products, gold, electrical equipment, chemical fertilizer, and coal among others decreased in the review period.
Based on custom points, exports from Bhairahawa, Biratnagar, Birgunj, Dry Pot, Kailali, Krishnanagar, Mechi, Nepalgunj, Rasuwa and Tribhuwan Airport Custom offices increased whereas exports from all other major customs points decreased in the review period. On the import side, imports from Jaleshwor and Tribhuwan Airport Custom offices decreased whereas imports from all other major customs points increased in the review period.
Total trade deficit increased 6.3 percent to Rs.1397.23 billion during the eleven months of 2024/25. Such a deficit had decreased 1.7 percent in the corresponding period of the previous year. The export-import ratio increased to 15.1 percent in the review period from 9.6 percent in the corresponding period of the previous year.
During the eleven months of 2024/25, merchandise imports from India against payment in convertible foreign currency amounted Rs.167.30 billion. Such amount was Rs.137.13 billion in the same period of the previous year.
Composition of Foreign Trade
As per the Broad Economic Categories (BEC), the final consumption, intermediate and capital goods accounted for 67.3 percent, 31.7 percent, 1.0 percent of the total exports respectively in the review period. In the same period of the previous year, the ratio of final consumption, intermediate and capital goods remained 42.8 percent, 56.5 percent, and 0.62 percent respectively in the same period of the previous year.
On the imports side, the share of final consumption, intermediate and capital goods remained 39.4 percent, 51.6 percent, and 9.1 percent in the review period. Such ratios were 41.9 percent, 48.7 percent, and 9.4 percent respectively in the same period of the previous year.