

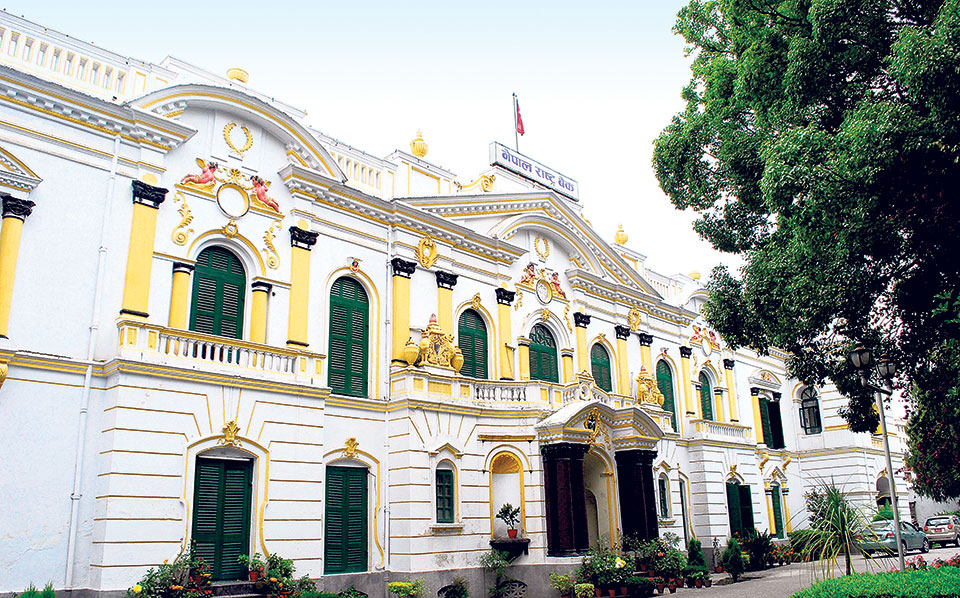
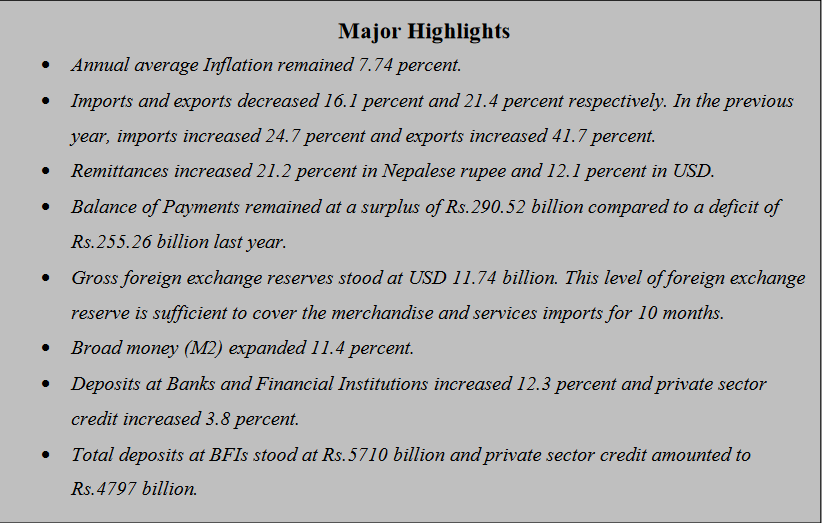
Kathmandu, Aug 18: The Nepal Rastra Bank (NRB), the central bank of Nepal, has said that the remittance inflows has increased 21.2% to Rs.1220.56 billion during 2022/23 compared to an increase of 4.8 percent in the previous year.
Unveiling “Current Macroeconomic and Financial Situation of Nepal of FY 2022/23”, NRB said that in the US Dollar terms, remittance inflows increased 12.1 percent to 9.33 billion in the review year compared to an increase of 2.2 percent in the previous year.
Number of Nepali workers (institutional and individual-new) taking approval for foreign employment increased 40.3 percent to 497,704 in the review year. It had increased 392.0 percent in the previous year. The number of Nepali workers (Renew entry) taking approval for foreign employment decreased 1.8 percent to 277,272 in the review year. It had increased 198.5 percent in the previous year, it said.
Net transfer increased 20.6 percent to Rs.1348.48 billion in the review year. Such a transfer had increased 4.3 percent in the previous year.
Current Account and Balance of Payments
The current account remained at a deficit of Rs.72.16 billion in the review year compared to a deficit of Rs.623.38 billion in the previous year. In the US Dollar terms, the current account registered a deficit of 557.12 million in the review year compared to deficit of 5.17 billion in the previous year.
In the review year, capital transfer decreased 24.5 percent to Rs.7.54 billion and net foreign direct investment (FDI) remained Rs.5.96 billion. In the previous year, capital transfer and net FDI amounted to Rs.9.99 billion and Rs.18.56 billion respectively. Balance of Payments (BOP) remained at a surplus of Rs.290.52 billion in the review year against a deficit of Rs. 255.26 billion in the previous year. In the US Dollar terms, the BOP remained at a surplus of 2.21 billion in the review year compared to a deficit of 2.15 billion in the previous year.
Foreign Exchange Reserves
Gross foreign exchange reserves increased 26.6 percent to Rs.1539.36 billion in mid-July 2023 from Rs.1215.80 billion in mid-July 2022. In the US dollar terms, the gross foreign exchange reserves increased 23.1 percent to 11.74 billion in mid-July 2023 from 9.54 billion in mid-July 2022.
Of the total foreign exchange reserves, reserves held by NRB increased 27.4 percent to Rs. 1345.78 billion in mid-July 2023 from Rs. 1056.39 billion in mid-July 2022. Reserves held by banks and financial institutions (except NRB) increased 21.4 percent to Rs. 193.59 billion in mid-July 2023 from Rs.159.41 billion in mid-July 2022. The share of Indian currency in total reserves stood at 22.5 percent in mid-July 2023.
Foreign Exchange Adequacy Indicators
Based on the imports of 2022/23, the foreign exchange reserves of the banking sector is sufficient to cover the prospective merchandise imports of 11.7 months, and merchandise and services imports of 10 months.
The ratio of reserves-to-GDP, reserves-to-imports and reserves-to-M2 stood at 28.6 percent, 83.0 percent and 25.1 percent respectively in mid-July 2023. Such ratios were 24.6 percent, 57.8 percent and 22.1 percent respectively in mid-July 2022.
Services
Net services income remained at a deficit of Rs.83.85 billion in 2022/23 compared to a deficit of Rs.108.12 billion in the previous year. Under the service account, travel income increased 89.6 percent to Rs. 61.52 billion in the review year which was Rs.32.45 billion in the previous year.
Under the service account, travel payments increased 48.4 percent to Rs.144.46 billion, including Rs.100.42 billion for education in the review year. Such payments were Rs.97.32 billion and Rs.67.70 billion respectively in the previous year.
Merchandise Trade
During 2022/23, merchandise exports decreased 21.4 percent to Rs.157.14 billion against an increase of 41.7 percent in the previous year. Destination-wise, exports to
India decreased 31.3 percent whereas exports to China and other countries increased 118.3 percent and 10.7 percent respectively.
Exports of zinc sheet, particle board, cardamom, woolen carpets, polyster yarn and thread, among others, increased whereas exports of soyabean oil, palm oil, oil cakes, textiles, silverware and jewelleries, among others, decreased in the review period.
In the review year, merchandise imports decreased 16.1 percent to Rs.1611.73 billion against an increase of 24.7 percent a year ago. Destination-wise, imports from India, China and other countries decreased 14.4 percent, 15.9 percent, and 20.7 percent respectively. Imports of sponge iron, chemical fertilizer, other stationeries, bitumen, paper, among others, increased whereas imports of transport equipment & parts, M.S. billet, medicine, petroleum products, crude soyabean oil, among others, decreased in the review year.
Based on customs points, exports from Bhairahawa, Dry Port, Jaleshwor, Krishnanagar, Mechi, Rasuwa, Tatopani and Tribhuwan Airport Customs Offices increased whereas exports from all the other major customs points decreased in the review year. On the import side, imports from Rasuwa Customs Office increased whereas imports from all the other major customs points decreased in the review year.
Total trade deficit decreased 15.5 percent to Rs.1454.59 billion in the review year. Such a deficit had increased 23.0 percent in the previous year. The export-import ratio decreased to 9.7 percent in the review year from 10.4 percent in the previous year. In the review year, merchandise imports from India against payment in convertible currency amounted to Rs.154.42 billion. Such imports was Rs.213.53 billion in the previous year.
Consumer Price Inflation
The annual average consumer price inflation stood at 7.74 percent in FY 2022/23 compared to 6.32 percent a year ago. Under the food and beverage category, the
annual average consumer price index of restaurant & hotel sub-category increased 14.42 percent, spices 12.50 percent, cereal grains & their products 10.70 percent,
tobacco products 9.88 percent and milk products & eggs 9.23 percent.
Likewise, under the non-food and services category, the annual average consumer price index of transportation sub-category increased 13.50 percent, recreation &
culture 10.18 percent, health 10.01 percent, education 8.79 percent and housing & utilities 8.65 percent.
The y-o-y consumer price inflation stood at 7.44 percent in mid-July 2023 compared to 8.08 percent a year ago.
Full Text
Current-Macroeconomic-and-Financial-Situation-English-Based-on-Annual-data-of-2022.23