

Kathmandu, Nov 16: The Nepal Rastra Bank (NRB), the central bank of Nepal, has said that the current account and balance of payments remained at a surplus of Rs.237.59 billion and Rs.264.03 billion respectively.
According to “Current Macroeconomic and Financial Situation, based on three months data (ending mid-October) of 2025/26”, the current account remained at a surplus of Rs. 237.59 billion in the review period. Such surplus was Rs.115.36 billion in the same period of the previous year. In the US Dollar terms, the current account registered a surplus of 1.69 billion in the review period against a surplus of 860 million in the same period of the previous year.
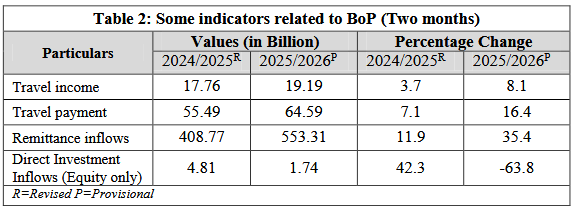
In the review period, net capital transfer amounted to Rs.5.55 billion. In the same period of the previous year, such transfer amounted to Rs.2 billion. Similarly, in the review period, Rs.1.74 billion foreign direct investment (equity only) was received. In the same period of the previous year, foreign direct investment inflow (equity only) amounted to Rs.4.81 billion.
Balance of Payments (BOP) remained at a surplus of Rs.264.03 billion in the review period. Such surplus was Rs.184.99 billion in the previous year. In the US Dollar terms, the BOP remained at a surplus of Rs.1.88 billion in the review period compared to a surplus of Rs. 1.38 billion in the same period of the previous year.
Remittance inflow increase 35.4 percent
Likewise, remittances have increased 35.4 percent in NPR terms and 29.2 percent in USD terms. During mid-September to mid-October, remittance inflows stood at Rs. 201.22 billion.
Remittance inflows increased 35.4 percent to Rs.553.31 billion in the three months of 2025/26 compared to an increase of 11.9 percent in the same period of the previous year. During mid-September to mid-October (Ashoj month), remittance inflows stood at Rs. 201.22 billion. In the same period of the previous year, such inflows were Rs. 144.17 billion.
In the US Dollar terms, remittance inflows increased 29.2 percent to 3.94 billion in the review period. Such inflow had increased 10.6 percent in the same period of the previous year. Net secondary income (net transfer) reached Rs.610.61 billion in the review period. Such income was Rs.443.76 billion in the same period of the previous year.
The number of Nepali workers, both institutional and individual, taking first-time approval for foreign employment stands at 123,459 and taking approval for renew entry stands at 77,257. In the same period of the previous year, such numbers were 110,654 and 59,939 respectively.
Foreign Exchange Reserves
Gross foreign exchange reserves increased 11.3 percent to Rs.2979.81 billion in mid-October 2025 from Rs.2677.68 billion in mid-July 2025. In the US dollar terms, the gross foreign exchange reserves increased 8.7 percent to 21.21 billion in mid-October 2025 from 19.50 billion in mid-July 2025.
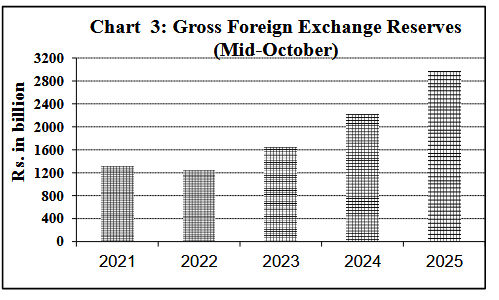
Of the total foreign exchange reserves, the reserves held by NRB increased 10.5 percent to Rs.2667.7 billion in mid-October 2025 from Rs. 2414.64 billion in mid-July 2025. Reserves held by banks and financial institutions (except NRB) increased 18.7 percent to Rs.312.1 billion in mid-October 2025 from Rs.263.04 billion in mid-July 2025. The share of Indian currency in total reserves stood at 24 percent in mid- October 2025.
Foreign Exchange Adequacy Indicators
Based on the imports of the three months of 2025/26, the foreign exchange reserves of the banking sector is sufficient to cover the prospective merchandise imports of 19.9 months, and merchandise and services imports of 16.4 months. The ratio of reserves-to-GDP, reserves-to-imports and reserves-to-M2 stood at 48.8 percent, 136.6 percent, and 36.8 percent respectively in mid-October 2025. Such ratios were 43.8 percent, 128.1 percent, and 34.1 percent respectively in mid-July 2025.
Composition of Foreign Trade
As per the Broad Economic Categories (BEC), the final consumption, intermediate, and capital goods accounted for 69.0 percent, 30.4 percent, and 0.6 percent of the total exports respectively in the review period. In the same period of the previous year, the ratio of the final consumption, intermediate, and capital goods remained 47.6 percent, 51.3 percent, and 1.1 percent of total exports respectively.
On the imports side, the share of final consumption, intermediate, and capital goods remained 38.0 percent, 53.3 percent, and 8.7 percent in the review period. Such ratios were 42.5 percent, 49.0 percent, and 8.5 percent respectively in the same period of the previous year.
Export-Import Price Index
The y-o-y unit value export price index, based on customs data, decreased 2.2 percent whereas the import price index increased 2.3 percent in the third month of 2025/26. The terms of trade (ToT) index decreased 4.4 percent during the same period.
Merchandise Trade
During the three months of 2025/26, merchandise exports increased 89.6 percent to Rs.72.78 billion against a decrease of 6.1 percent in the same period of the previous year. Destination-wise, exports to India and other countries increased 137.9 percent and 3.8 percent respectively whereas exports to China decreased 66.1 percent. Exports of soyabean oil, palm oil, jute goods, cardamom and polyster yarn and thread among others increased whereas exports of zinc sheet, particle board, tea, woolen carpet and oil cakes among others decreased in the review period.
During the three months of 2025/26, mercandise imports increased 19.8 percent to Rs.468.08 billion against a decrease of 4.2 percent a year ago. Destination-wise, imports from India, China, and other countries increased 7.5 percent, 33.4 percent, and 46.5 percent respectively. Imports of crude soyabean oil, chemical fertilizer, gold, transport equipment, vehicle and spare parts, and telecommunication equipments and parts among others increased whereas imports of hot rolled sheet in coil, edible oil, garlic, oil seeds and petroleum products among others decreased in the review period.
Total trade deficit increased 12.2 percent to Rs.395.30 billion during the three months of 2025/26. Such a deficit had decreased 4.0 percent in the corresponding period of the previous year. The export-import ratio increased to 15.5 percent in the review period from 9.8 percent in the corresponding period of the previous year.
During the three months of 2025/26, merchandise imports from India against payment in convertible foreign currency amounted Rs.40.79 billion. Such amount was Rs.44.13 billion in the same period of the previous year.
Composition of Foreign Trade
As per the Broad Economic Categories (BEC), the final consumption, intermediate, and capital goods accounted for 69.0 percent, 30.4 percent, and 0.6 percent of the total exports respectively in the review period. In the same period of the previous year, the ratio of the final consumption, intermediate, and capital goods remained 47.6 percent, 51.3 percent, and 1.1 percent of total exports respectively.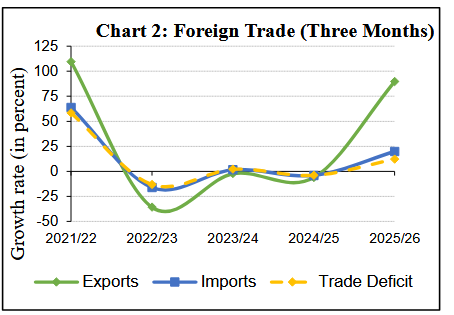
On the imports side, the share of final consumption, intermediate, and capital goods remained 38.0 percent, 53.3 percent, and 8.7 percent in the review period. Such ratios were 42.5 percent, 49.0 percent, and 8.5 percent respectively in the same period of the previous year.
Export-Import Price Index
The y-o-y unit value export price index, based on customs data, decreased 2.2 percent whereas the import price index increased 2.3 percent in the third month of 2025/26. The terms of trade (ToT) index decreased 4.4 percent during the same period.
Consumer Price Inflation (CPI)
The y-o-y consumer price inflation stood at 1.47 percent in mid-October 2025 compared to 4.82 percent a year ago. Food and beverage inflation decreased 2.54 percent whereas non-food and service inflation stood at 3.80 percent in the review month. During the same period in the previous year, the price indices of these groups had increased 7.20 percent and 3.49 percent, respectively. The average inflation stood at 1.67 percent in the first quarter of current fiscal year compared to 4.26 percent a year ago.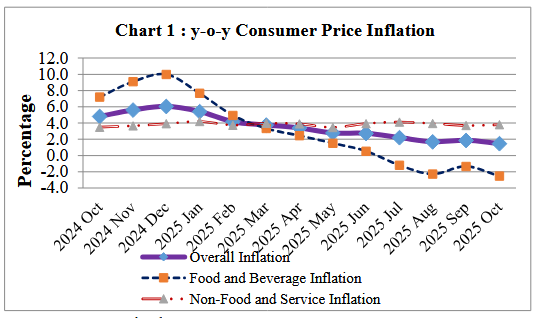
Under the food and beverage category, y-o-y price index of ghee & oil sub-category increased 7.75 percent, non-alcoholic drinks 3.71 percent and meat & fish 3.15 percent while y-o-y price index of vegetable sub-category decreased 15.63 percent, spices 7.82 percent and pulses & legumes 4.41 percent.
Under the non-food and services category, y-o-y price index of miscellaneous goods & services sub-category increased 15.51 percent, education 7.67 percent, clothes and footwear 6.29 percent, tobacco products 4.84 percent, and furnishing & household equipment 4.55 percent while y-o-y price index of insurance & financial services sub-category decreased 0.23 percent.
During the review month, y-o-y price index in rural areas increased 1.29 percent, while in urban areas, it rose 1.53 percent. #NRB #economy #nepal
READ FULL TEXT